题库 / EAOfficialPractice-GI-13

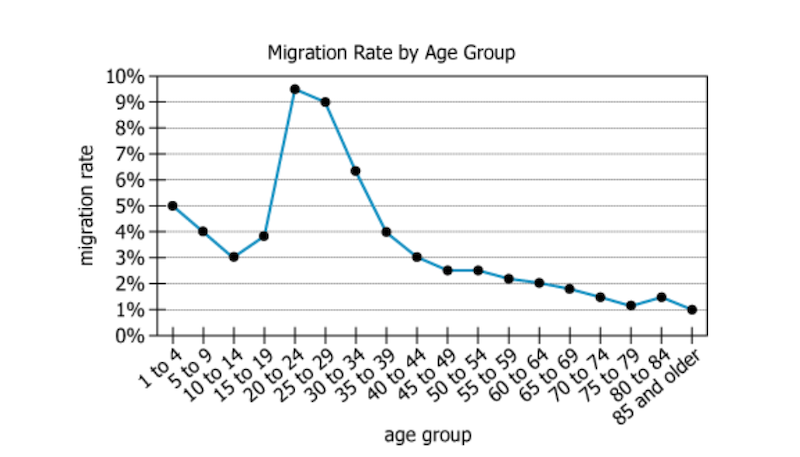
A significant number of people surveyed in the most recent census had migrated, that is, they had a different physical address in that census compared to the prior one. The migration rate is the percentage of an entire population that has migrated. For each age group, the graph shows the migration rate in the most recent census.
From each drop-down menu, select the option that creates the most accurate statement based on the information given.
Among the age groups along the horizontal axis of the graph, the range of the migration rates is, to the nearest half percent, %.
Between any two consecutive age groups along the horizontal axis, the greatest difference in migration rates is, to the nearest half percent, %.
还没有题目讲解(毕出老师会陆续发布对官方考题的解读,请保持关注)。