题库 / EAOfficialPractice-GI-14

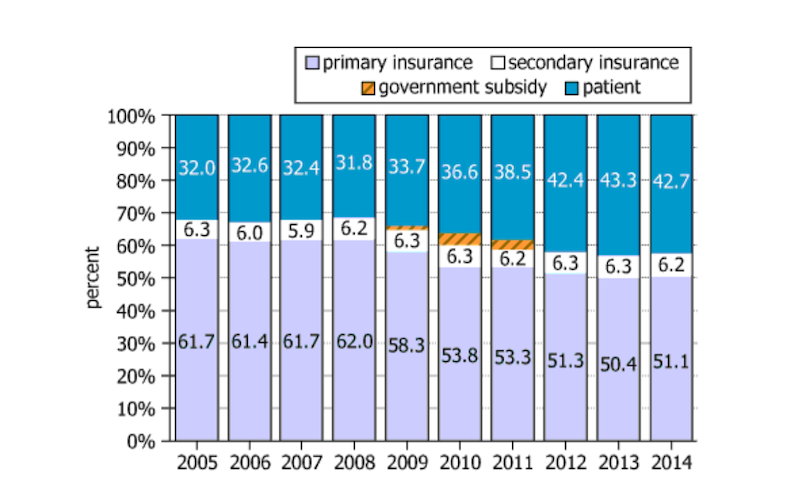
The graph shows the distribution of funding sources for medical expenses incurred at a certain hospital in Country C for the years 2005-2014. For example, in 2005, 61.7% of medical expenses incurred at this hospital were paid by the patient’s primary insurance, 6.3% by the patient’s secondary insurance, and 32.0% by the patient. In the years 2009, 2010, and 2011, the government of Country C provided a subsidy that paid a small percent of the medical expenses.
Based on the information provided, select the option from each drop-down menu that creates the most accurate statement.
The ratio of the percent paid by the patient to the percent paid by the patient’s primary insurance was greatest in the year and least in the year .
还没有题目讲解(毕出老师会陆续发布对官方考题的解读,请保持关注)。