题库 / EAOfficialPractice-GI-25

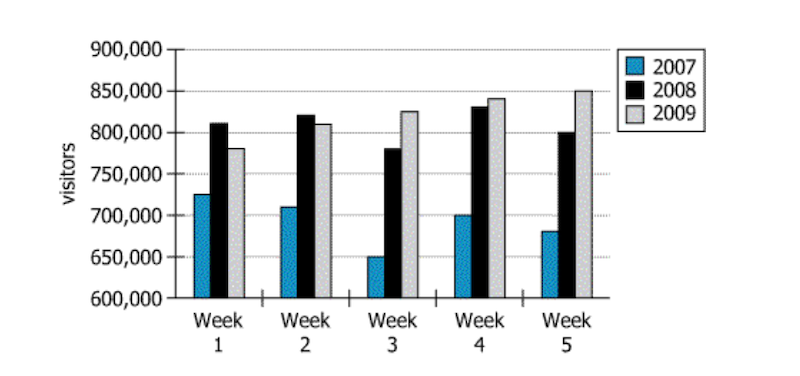
The graph shows, for the first five weeks in each of three years, the number of visitors to websites devoted to real estate in New Zealand.
Select from the drop-down menus the options that complete the statement so that it most accurately reflects the information provided in the graph.
For the 15 weeks shown, the range of numbers of visitors is equal to the number for .
For the 15 weeks shown, the range of numbers of visitors is the median of the numbers of visitors.
还没有题目讲解(毕出老师会陆续发布对官方考题的解读,请保持关注)。