题库 / EAOfficialPractice-GI-33

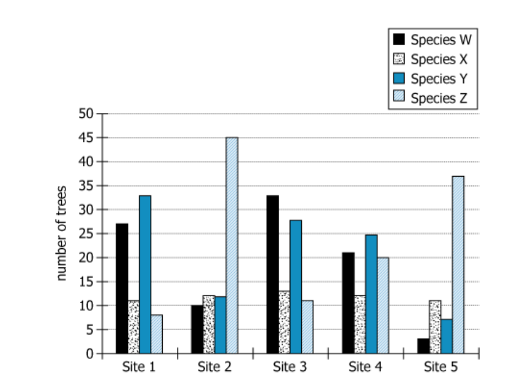
The graph shows the number of coniferous trees of each of 4 species at each of 5 sites located in a large ecological reserve.
Select from the drop-down menus the options that create the statement that most accurately reflects the information provided.
Comparing the total number of Species W trees at a site to the number of Species X, Y, and Z trees at that site, the graph shows the strongest positive correlation between the number of Species W and Species trees, and the strongest negative correlation between the number of Species W and Species trees.
还没有题目讲解(毕出老师会陆续发布对官方考题的解读,请保持关注)。