题库 / EAOfficialPractice-GI-39
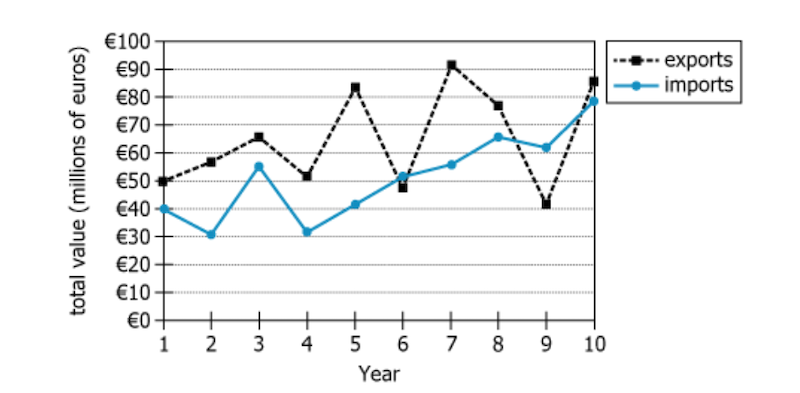
The graph shows the total value of Country X's exports to Country Y and the total value of Country X's imports from Country Y for each of 10 years.
Select from the drop-down menus the options that create the statement that most accurately reflects the information provided.
In Year the total value of Country X's imports from Country Y exceeded the total value of Country X's exports to Country Y by million euros, to the nearest 10 million euros.
还没有题目讲解(毕出老师会陆续发布对官方考题的解读,请保持关注)。