题库 / EAOfficialPractice-GI-4
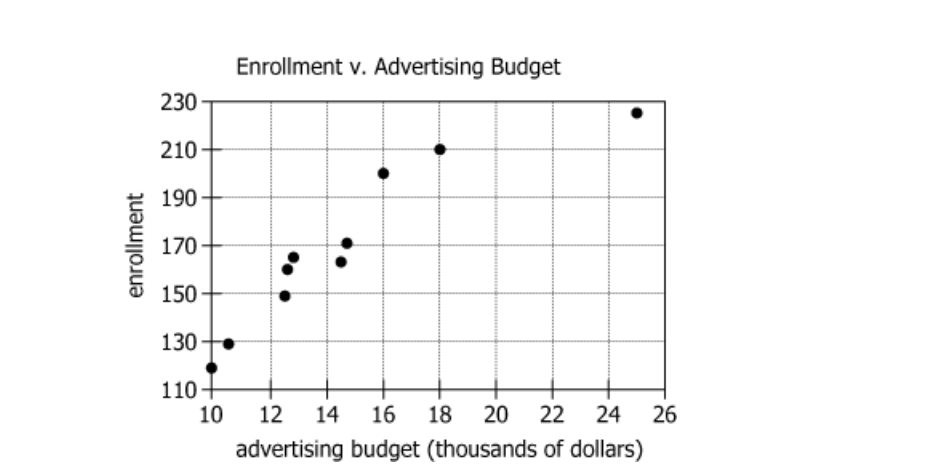
The graph shows the relationship between a child care center’s advertising budget and its annual enrollment over the previous 10 years.
Based on the information provided, from each drop-down menu, select the option that completes each statement in the most accurate manner.
The graph indicates a correlation between advertising budget and enrollment at the child care center.
During one of the years depicted in the graph, the total revenue was $1,890,000, or $9,000 per child. In this year, the advertising budget was .
还没有题目讲解(毕出老师会陆续发布对官方考题的解读,请保持关注)。