题库 / EAOfficialPractice-GI-6
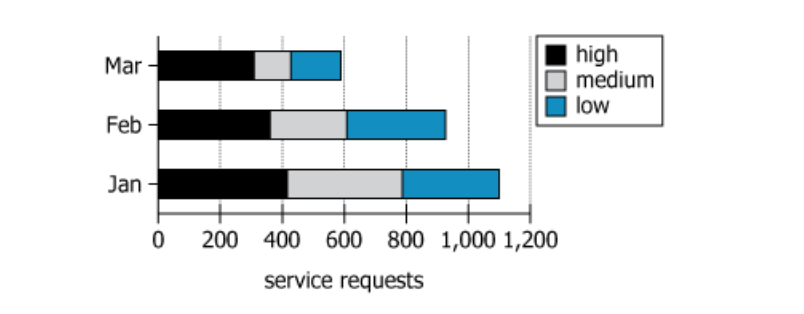
For each of the first three months of last year, the graph shows the number of service requests handled by the Technical Services department at a certain company and the number of those service requests that were high, medium, or low priority. For example, the graph shows that in March, the department handled approximately 590 requests: approximately 310 high priority, 120 medium priority, and 160 low priority.
Select from the drop-down menus the options that complete the statement so that it most accurately reflects the information provided.
Among the three months shown, the month for which high-priority requests constituted the greatest proportion of the total number of requests for the month is , and that month had total number of requests, among the three.