题库 / EAOfficialPractice-GI-89

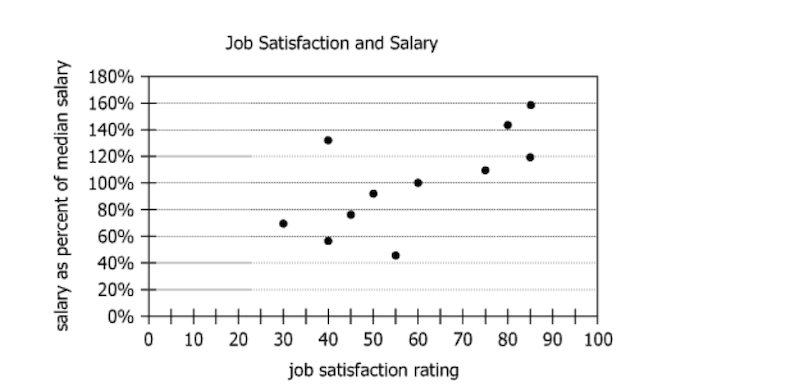
For each of the 11 employees of a small company, the graphic shows the employee’s salary (as a percent of the company’s median salary) and job satisfaction rating (given as a number between 0 and 100, where a higher rating represents greater job satisfaction).
From each drop-down menu, select the option that creates the most accurate statement based on the information provided.
The employee having the median job satisfaction rating had a salary (、、) the median salary.
The employee having the median salary had a job satisfaction rating (less than、equal to、greater than) the median rating.
还没有题目讲解(毕出老师会陆续发布对官方考题的解读,请保持关注)。