题库 / EAOfficialPractice-GI-98
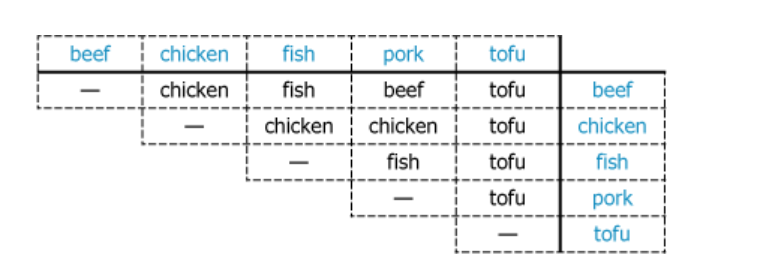
A restaurant asked a focus group to rate 5 new dishes, each of which features either beef, chicken, fish, pork, or tofu. The focus group was asked to make a comparison of each pair of dishes and to choose which of the two dishes they preferred. The graphic shows the focus group's preferences. For example, when the focus group compared the dish featuring beef to the dish featuring chicken, their preference was the dish featuring chicken, and this is indicated at the intersection of the horizontal row containing the label beef on the far right and the vertical column containing the label chicken at the top.
From each drop-down menu, select the option that creates the most accurate statement based on the information provided.
The focus group preferred the dish featuring to every other dish.
The focus group preferred every other dish to the dish featuring .