题库 / EAOfficialPractice-TA-58
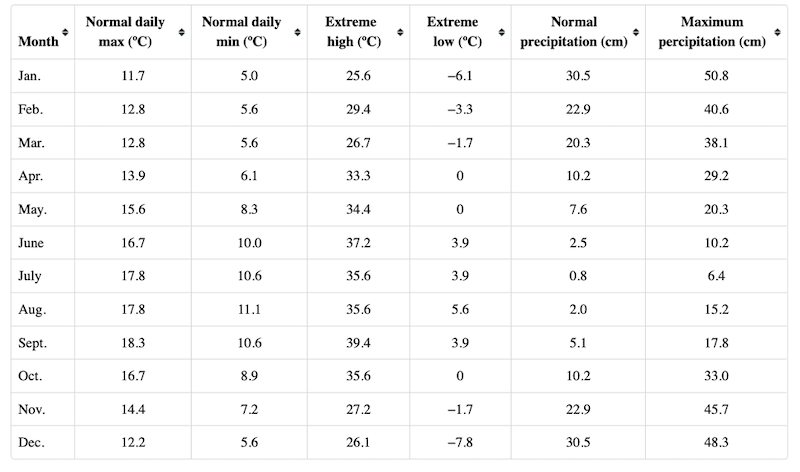
The table shows the normal and extreme high and low temperatures, and the normal and maximum amounts of precipitation, for each month of the year at the same location. The numbers are rounded, so identical numbers may represent slightly different quantities.

For each of the following statements, select Yes if the statement is accurate based on the information provided. Otherwise select No.
| YES | NO | |
|---|---|---|
|
|
|
The three months with the greatest normal daily minimum temperatures also have the greatest normal daily maximum temperatures.
|
|
|
|
The three months with the greatest maximum amounts of precipitation also have the least extreme-high temperatures.
|
|
|
|
The four months with the least normal amounts of precipitation also have the greatest normal daily minimum temperatures.
|
还没有题目讲解(毕出老师会陆续发布对官方考题的解读,请保持关注)。