题库 / GMATLA-GI-10
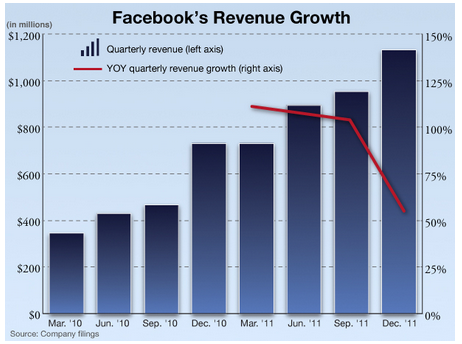
This is a bar graph of Facebook's revenue growth from the beginning of 2010 to the end of 2011. The left axis corresponds with the bars illustrating Facebook's revenue in millions. The right axis illustrates the year over year quarterly revenue growth rate beginning in the quarter ending March 2011.
Use the drop-down menus to fill in the blanks in each of the following statements based on the information on the chart.
A) Facebook earnedmore in 2011 than it did in 2010.
B) Facebook's revenue for the Mar'12 quarter would have to beif the year over year growth for that quarter is at 50%.
还没有题目讲解(毕出老师会陆续发布对官方考题的解读,请保持关注)。
第二题,是说比上一年同一季度多50%,而不是比上一季度也就是上一年的第四季度多50%
第二问为什么是1.1呀,dec11不是就已经1.1了吗?
the year over year growth for that quarter is at 50%,就是Mar'12对于Mar'11增长50%,Mar'11是710。
登录 或 注册 后可以参加讨论