题库 / GMATLA-GI-17

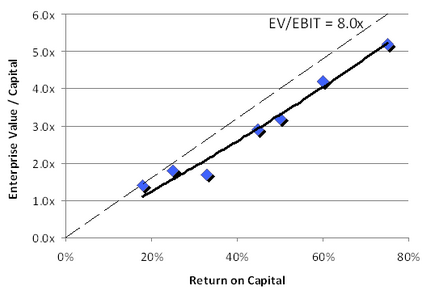
The graph here is a scatter plot of 7 points, each representing a company's return on capital and EV/Capital ratio in the fictitious Widgets industry.
Return on Capital is defined as EBIT (Earnings Before Interest and Taxes) divided by Capital (or EBIT/Capital).
The slope provided is y-axis over x-axis; here the slope is (EV/capital) / (EBIT/captial) = EV/EBIT. An EV/EBIT slope of 8.0x is drawn as a dotted line.
Use the drop-down menus to fill in the blanks in each of the following statements based on the information given by the graph.
A) Among the companies listed, if a company had a ROC % no more than 40%, it had EV/Capital ratios of no more than.
B) Referencing the 8.0x EV/EBIT slope, the appropriate EV/EBIT multiple for the Widgets industry is most closest to.
第一小题需要注意,第一不要用图中黑色虚线表示的斜率8乘以0.4得到3.2,然后看选项中3离3.2最近,就选3作为答案,因为1)虚线表示的斜率比真实的回归斜率要高,用8计算得到的数字大了,2)最重要的,题目说的是在图中的几个公司中判断,那么一个公司的ROC小于40%,由图中可知为从左往右数第二个点,它的斜率是小于2的,所以不选3,选2
登录 或 注册 后可以参加讨论