题库 / GMATLA-GI-19
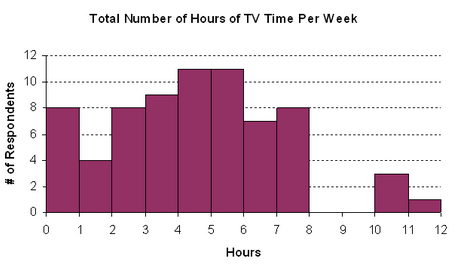
70 students responded to a survey documenting the amount of time spent on television.
The results are summarized in the graph as follows: 8 watched fewer than 1 hr of TV per week, 4 watched at least 1 hour but less than 2, and so on.
Based on the given information, use the drop-down menus to most accurately complete the following statements.
A) The least possible value for the mean of the numbers of hours of TV reported for the week is.
B) The number of respondents who watched on average less than 3/4 hour per day during the week is between.
还没有题目讲解(毕出老师会陆续发布对官方考题的解读,请保持关注)。
审题不仔细导致错。3/4小时每天 每周就是5个小时多一点
为啥不是0-8