题库 / GMATLA-GI-2

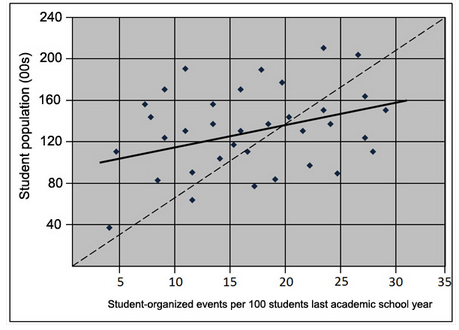
This graph plots some data of the number of student-organized events on campus in a particular calendar year. The metrics used on the X-axis is events per 100 students. This is plotted against the total student population of that university campus. There is a dashed line that runs from the origin (0,0) to the upper right of the graph corresponding to 35 student events and 24,000 students
A) According to this chart, a university with more than 10 student-organized events per 100 students isto have a student population of at least 12,000 people.
B) The school with the smallest student body was also the school with the fewest student-organized events per hundred students.
还没有题目讲解(毕出老师会陆续发布对官方考题的解读,请保持关注)。