题库 / GMATLA-GI-20
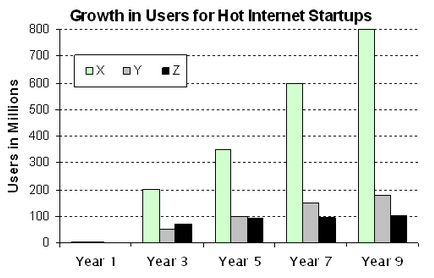
The graph shows the estimated number of users for 3 hyper-growth internet startups in 5 selected years, each launched in the same year. Companies X, Y and Z are all subsidiaries within Holding Company A. The number of users across all of Holding Company A's web properties was 1 billion in Year 1 and 2.8 billion in Year 9.
From each drop-down menu, select the option that creates the most accurate statement based on the information provided.A) The increase in the estimated number of users in Company Z from Year 1 to 9 accounts for approximately% of the increase in the estimated number of users across all of Holding Company A's web properties.
B) In Year 9, the estimated number of users cumulatively across Companies X, Y, and Z wasof the estimated users across all of Holding Company A's web properties.