题库 / GMATLA-GI-27
Apple Stock Price
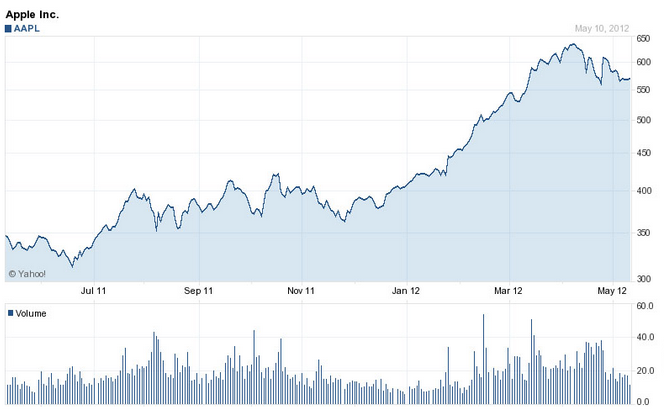
The stock chart to the left shows the price of Apple stock from the May 2011 to May 2012. The corresponding bar graph on the bottom displays the average daily volume for Apple stock on any given day. For example, if 1 million shares of Apple were traded on a particular day where Apple was roughly at $100 per share, then $100M worth of Apple stock was traded that day.
A) The dollar ($) amount of Apple stock that was traded per day near the trough of the stock in June of 2011 was closest to of the dollar amount of Apple stock that was traded just after the stock peaked in April of 2012 and trended lower.
B) How many of Apple's 75 percentage point increase in stock price from Dec 2011 to the peak in April 2012 was erased by the following decline from 630 to 555?