题库 / GMATLA-GI-4
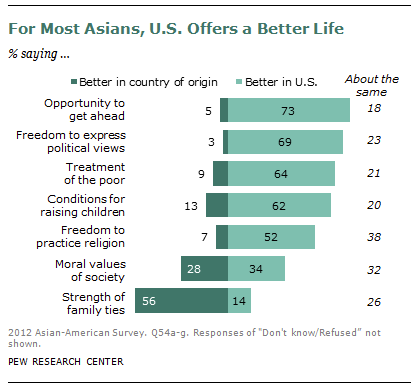
The graph to the left shows the results of a survey of Asian Americans and their perspective on life in America. Respondents who replied "Don't know" are not included in the chart. Note the lifestyle aspect of Strength of family ties provides an outlier data point relative to other lifestyle categories.
A) The average (arithmetic mean) of the percentage of respondents that said a particular lifestyle aspect was better in their country of origin waspercentage points higher with the inclusion of the skewed outlier data point than it was without the inclusion of the skewed outlier data point.
B) On average, the number of respondents who did not respond for each of the lifestyle categories was
还没有题目讲解(毕出老师会陆续发布对官方考题的解读,请保持关注)。
skewed outlier data point 偏离的异常数据
“Skewed outlier data point” 不单是极值,它特指那些 异常值,并且它们对数据分布造成了 偏斜影响。可以理解为“引起偏态分布的极端离群点”。
登录 或 注册 后可以参加讨论