题库 / GMATLA-GI-7
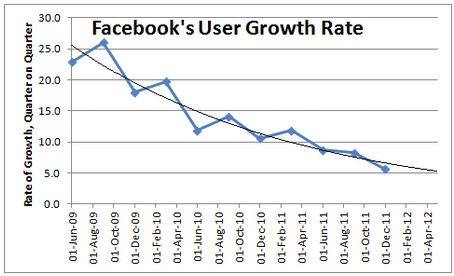
This is a Time VS QoQ Rate of Growth chart for Facebook between June 2009 and April 2012 - just before its IPO in May 2012. The dotted line shows actual data while the smooth line shows an estimated regression of those data points.
Choose the appropriate drop down that best fills in the sentence with accurate information about the graph.
A) The quarter over quarter growth rate tookmonths to fall from the 10%-15% range down to the 5%-10% range.
B) The graph shows there tends to be a seasonal effect on the decline of Facebook's rate of growth during the time period shown.
还没有题目讲解(毕出老师会陆续发布对官方考题的解读,请保持关注)。
第二问的Seasonal Effect怎么看?有些季度上升,有些季度下降,不应该是看不出影响吗?
登录 或 注册 后可以参加讨论