题库 / GMATLA-GI-9

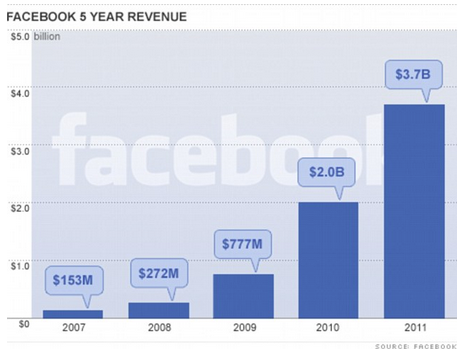
This is a bar graph of Facebook's revenue for each of the 5 listed years from 2007 to 2011.
Select the drop down that most accurately fills in the blank.
A) Facebook's revenue growth rate first slowed from the previous year's growth rate.
B) Facebook would have to repeat its 2007 revenue performancetimes in order to exceed its sales in 2011.
还没有题目讲解(毕出老师会陆续发布对官方考题的解读,请保持关注)。
exceed,所以25
登录 或 注册 后可以参加讨论