题库 / GMATLA-TA-8
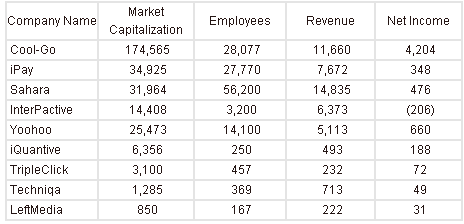
The table below gives information for 9 publicly traded companies in the same industry. The following metrics are expressed in millions of US Dollars ($): Market Capitalization, Revenue, and Net Income.
The market capitalization (market cap) is as of June 1, 2012 while other income statement metrics (revenue and net income), are as of Dec 31, 2011. The number of employees is as of December 31, 2011

For each of the following, select Yes if the statement is true based on the information provided; otherwise select No.
| Yes | No | |
|---|---|---|
|
|
|
Cool-Go has the highest revenue per employee
|
|
|
|
If profit margin is defined as the ratio of net income to revenue, Cool-Go has the highest profit margin.
|
|
|
|
If earnings yield is defined as net income divided by market capitalization, Cool-Go has the highest earnings yield.
|
还没有题目讲解(毕出老师会陆续发布对官方考题的解读,请保持关注)。