题库 / GMATLA-MSR-11
Kilometer Run
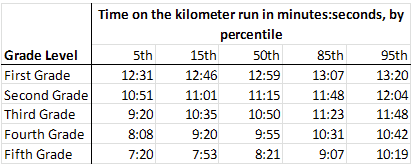
The Huffingdale All Boys School has produced a comprehensive set of running standards for young boys. These standards are based on data from young boys attending Huffingdale in good health conditions - as determined by a physician. The table displays the percentile distribution of time on a kilometer run for Huffingdale students at grade levels 1 through 5 according to the Huffingdale model. In a model population -- a large population of young students grade 1 through 5 that conforms to the Huffingdale running standards -- for n=5, 15, 50, 85, and 95, the nth percentile in running time for a given grade is the unique running time among boys of that grade level that is slower than or equal to n percent, and faster than or equal to (100 - n) percent, of running times for students of that grade level.

Height
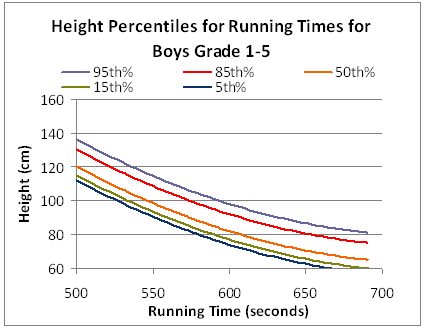
The graph shows the percentile distribution of height, in centimeters, for running times from 500 to 700 seconds, according to the Huffingdale model. In a model population, for n=5, 15, 50, 85, and 95, the nth percentile in height for a given running time is the unique height among boys of that running time that is taller than or equal to n percent, and shorter than or equal to (100-n) percent, of heights of boys of that running time.

For each of the following statements, select Yes if the statement must be true of a boy selected at random from a model population. Otherwise, select No.
| Yes | No | |
|---|---|---|
|
|
|
If he is in the third grade or above, the probability that his speed is faster than 10:50 is greater than 50%.
|
|
|
|
If he runs at least a 10 minute kilometer run (no slower), the probability that his height is up to 73cm is no greater than 5%.
|
|
|
|
If he runs an 8 minute kilometer run, he is faster than at least 95% of boys of his same grade level.
|
题目都读不懂看吐了
登录 或 注册 后可以参加讨论