题库 / GMATLA-MSR-14
Kilometer Run
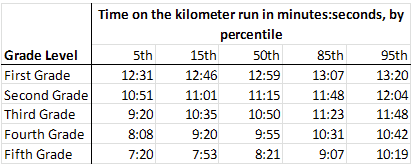
The Huffingdale All Boys School has produced a comprehensive set of running standards for young boys. These standards are based on data from young boys attending Huffingdale in good health conditions - as determined by a physician. The table displays the percentile distribution of time on a kilometer run for Huffingdale students at grade levels 1 through 5 according to the Huffingdale model. In a model population -- a large population of young students grade 1 through 5 that conforms to the Huffingdale running standards -- for n=5, 15, 50, 85, and 95, the nth percentile in running time for a given grade is the unique running time among boys of that grade level that is slower than or equal to n percent, and faster than or equal to (100 - n) percent, of running times for students of that grade level.

Height
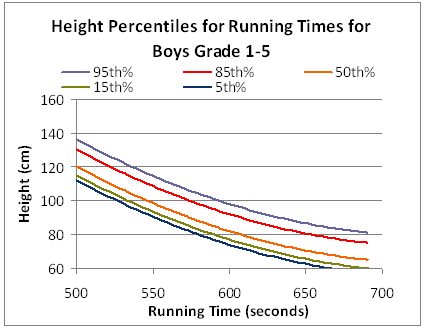
The graph shows the percentile distribution of height, in centimeters, for running times from 500 to 700 seconds, according to the Huffingdale model. In a model population, for n=5, 15, 50, 85, and 95, the nth percentile in height for a given running time is the unique height among boys of that running time that is taller than or equal to n percent, and shorter than or equal to (100-n) percent, of heights of boys of that running time.

Joshua is a boy in the 3rd grade whose kilometer run time is 11:20 and whose height is 81cm. For each of the following statements, select Yes if, based on the given information, it must be true of Joshua relative to a model population. Otherwise, select No.
| Yes | No | |
|---|---|---|
|
|
|
Approximately 95% of boys at the same height are slower than Joshua.
|
|
|
|
No more than 15% of boys at this grade level are slower than Joshua.
|
|
|
|
Joshua's speed is faster than or equal to that of 50% of boys in the second grade.
|
头痛